Time and again public clouds really prove that if you got to scale rapidly, there is no better place on earth you can. This time, it was the new email service Hey from the creators of Basecamp. Here’s an execellent write up from the company on how AWS helped them scale rapidly when they got way too much attention to their product.
However, one interesting thing that struck me was this statement:
Another gotcha: some services can rack up bills when you least expect it, like CloudWatch Logs. It integrates so easily with EKS! It’s just one button to click! And then you’re looking at your bill, going “where did this extra $50-$60 per day come from?”
CloudWatch Logs allows you to ingest logs from various sources (your EC2 Instances, Containers, Lambda functions, tons of AWS services), store them centrally, analyze and gain insights. It’s a great service and anyone who has managed log aggregation at scale would appreciate the service a lot.
It is also pretty easy to turn on this service. AWS has deeply integrated CloudWatch Logs with a whole lot of its managed services (such as VPC Flow Logs, EKS Control Plane logs). For serverless services such as AWS Lambda, API Gateway, CloudWatch Logs is the only mechanism to collect logs.
However, one of the key challenges with CloudWatch Logs is how expensive the service can turn out to be.
There are two aspects to CloudWatch Logs Pricing:
- Ingestion Cost – at $0.5 per GB of log ingested
- Storage Cost – at $0.03 per GB of logs stored
Ingestion Cost
Ingestion cost, while seems reasonably priced at the first glance, typically becomes a major line item in your bill. On a reasonably busy application/service, this can easily become 1000s of dollars every month.
From AWS perspective, there is a good rationale to price it at $0.5 per GB. Ingestion means AWS needs to provision enough compute resources to capture all those logs being pushed to the service.
When sending logs to CloudWatch Logs is as simple as selecting a checkbox, it is virtually impossible for customers to think about how much they would end up paying for it. Think about VPC Flow logs – its just impossible to predict what the volumes could be.
Sure, over time one can begin to understand some trends between RPM and Log Ingestion rates. However, in practice, I have only seen developers focussing on optimizing CloudWatch logs only after someone at the top (typically who looks at the bill every month) brings the high costs of CloudWatch Logs to their notice.
Storage Cost
The storage cost is definitely much cheaper when compared to the ingestion costs. As you can see, it is priced similar to Standard S3 pricing because the logs are internally stored in S3.
However, one major gap that people discover later is that the default configuration of Log Groups is to store the logs forever. Here’s the relevant documentation that talks about the default retention policy.
So, its entirely left to the customer to figure this out and change the retention policy (and most customers figure this out only when they see a spike in their bill).
AWS Console Behavior
When you create a Log Group through the AWS Console, it just prompts you to provide a “Name”. “Retention Policy” is not asked as an input.
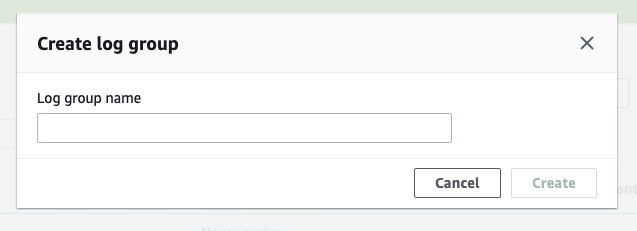
One needs to “Edit” the log group through the “Actions” menu to change the “Retention Policy” from the default “Forever” to something reasonable.

In fact, the behavior of the APIs are also similar. Here’s the create-log-group CLI command:
  create-log-group
--log-group-name <value>
[--kms-key-id <value>]
[--tags <value>]
[--cli-input-json | --cli-input-yaml]
[--generate-cli-skeleton <value>]
[--cli-auto-prompt <value>]
And one needs to use an additional put-retention-policy CLI command to change the retention policy:
  put-retention-policy
--log-group-name <value>
--retention-in-days <value>
[--cli-input-json | --cli-input-yaml]
[--generate-cli-skeleton <value>]
[--cli-auto-prompt <value>]
And for services such as EKS (which manages the Kubernets control plane), the only way to get the control plane logs is through CloudWatch Logs. If you look at the console, these are just simple checkboxes.

It’s pretty simple from usability perspective, but in this case, it’s the EKS service which abstracts the creation of the underlying Log Groups and the customer doesn’t really have the option to specify a retention policy.
On a busy EKS cluster, these logs can quickly grow and CloudWatch Logs can easily become one of the major line items of the AWS bill.
My Recommendations
Configure retention policies
Do NOT go with the default retention policies which retain the logs forever. A service like CloudWatch Logs is meant to be used as a Hot tier for logs. In Hot tier, logs are readily available for querying and dashboards. Most organizations need to have logs in “Hot” tier only for few weeks if not couple of months.
So, make sure you are configuring a reasonable “Retention Policy” for your Log Groups.
Archive to S3
Once you no longer need logs in Hot tier, you can move those logs to a Warm tier. In a Warm tier, logs are not readily avialable for querying but they can still be “accessed” readily (as files). One can download specific files of interest and query locally or even push such files on-demand to a query engine like ElasticSearch.
CloudWatch Logs provides an option to “Export Log Data to S3”. You can use this feature to periodically (using a “from” and “to” timestamp) export logs to S3. Please refer to this documentation for more details. Of course, you can automate this through the create-export-task API.
Of course, you do want to have a Lifecycle Policy created on those S3 buckets so that those Archived logs don’t live in S3 forever
Cost Allocation Tags for Log Groups
When CloudWatch Logs costs become a concern, one of the areas that organizations struggle is first identifying the source/owner of such high costs Log Groups. More often, the person who is doing the cost optimization exercise is not the same as the person who creates/manages infrastructure.
The standard and easiest way to address this is to use “Tagging”. Specific tags can be used as Cost Allocation Tags so that those tags appear in AWS bills and can be used to identify and allocate costs.
The good news is that CloudWatch Log Groups also support tagging. If your organization has a tagging strategy identified, you can use the same to tag Log Groups as well. This helps in identiying teams/owners when CloudWatch Logs costs become an area of concern.
The not-so-good news is that this Tagging feature is not available as part of the CloudWatch Management Console. However, its available as part of the APIs. Here’s the CLI command that can be used to tag a Log Group
  tag-log-group
--log-group-name <value>
--tags <value>
[--cli-input-json | --cli-input-yaml]
[--generate-cli-skeleton <value>]
[--cli-auto-prompt <value>]
Create Log Groups through Infrastructure As Code
Needless to say, it’s best to create Log Groups through some Infrastructure As Code (IAC) utility such as AWS CloudFormation or Terraform. Doing so, you can take care of retention policies and tagging automatically.
What’s interesting is though, the difference between these two popular methods of IAC:
- AWS CloudFormation seems to not support Tagging of Log Groups yet. But they do support configuring “RetentionPolicy”: https://docs.aws.amazon.com/AWSCloudFormation/latest/UserGuide/aws-resource-logs-loggroup.html
- Terraform on the other hand supports configuring both: https://www.terraform.io/docs/providers/aws/r/cloudwatch_log_group.html
Appropriate Log Levels
Of course this goes without saying: making sure code/application is logging at desired levels. You may not see the effect of too much verbose logging when you are logging to a file.
However, if the same code is deployed as a Lambda function, you will see a direct impact in CloudWatch Logs cost. Every line that is streamed to CloudWatch Logs is going to be factored as part of the $0.5 per GB Ingestion cost.
AWS can do a bit more
I think AWS can do a bit more to help customers here.
- Prompt for retention period during Log Group creation. Basically merge the
create-log-groupandput-retention-policyAPIs. At the time of creation of the Log Group itself, the Console and the APIs should take the “Retention Policy” as an input - Services where CloudWatch Logs is deeply integrated (such as EKS control plane logs, Lambda, API Gateway), provide the “Retention Policy” settings as part of the configuration
- Just like Vended Logs pricing, provide a tiered pricing for Data Ingestion. Or provide a commited discount (similar to RI) for Data Ingestion. Most applications can commit to certain volume of steady state logging and can benefit from discounts
Lastly, I have seen enough customers worrying about CloudWatch Logs in general. So much that even a reasonably large company like Basecamp worries about the service. I think AWS should really work towards addressing customers’ concerns with this service.
Logs are an important part of any application. While as developers and architects we love as much visbility through logs, it’s equally important to consider the trade offs with the actual cost of such visbility. Thinking ahead about the above aspects of CloudWatch Logs will go a long way in keeping costs of log aggregation under control.
Hope this article helped in understanding how to keep CloudWatch Logs costs under control. If you do use other techniques, please do share those in the comments section below – would love to hear those!!

Leave a comment