Tag: aws

  • Centralized Column Level Permissions in Data Lakes

    Almost every organization has a Data Lake today in some form or the other. Every cloud provider has simplified the process of building Data Lakes. On AWS, you can start having one with just these simple steps:

    • Create a S3 bucket
    • Ingest data into the S3 bucket (through Kinesis Firehose, APIs, etc…)
    • Use a Glue crawler to crawl that data and populate metadata in the Glue Catalog
    • Use Athena to start analysing the data through SQL

    With the above steps, you have data flowing into your Data Lake and you address few use cases. Once the above setup is in place, quickly the Data Lake would start collecting a lot of data. On the other hand, different folks in your organization would start accessing this data. And sooner than later, if you are the owner of this Data Lake, you start worrying about one big challenge.

    Data Access Control in Data Lakes

    As different users in your organization access the Data Lake, how do you implement “Access Control” mechanisms in your Data Lake? So that people with the right permissions & clearances can only view certain sensitive/confidential data.

    Let’s say your Data Lake holds customer information. You need to hold PII information such as email address and phone numbers for your marketing automation. At the same time, you do NOT want your Data Analysts to have access to this information (let’s say their typical use cases do not require access to email address and phone numbers).

    This has been addressed in Databases for many decades now. You implement “Access Control”. In Databases, you define fine grained permissions (typically through GRANT) on who can access what data.

    So, how do you implement something similar to a Data Lake? And more importantly where do you implement this access control?

    Access Control Permissions at the Data Catalog

    One of the key attributes of a Data Lake is the ability to use different tools to process & analyze the same data. Your Data Lake users could be using a SQL based tool today for some adhoc analysis and would later switch to running a Spark cluster for some compute intensive workload.

    So, you could implement Access Control at the individual tool level. For example, if you are using Amazon Athena and AWS EMR, you could implement permissions in these services to control who has access to the data being analyzed through these services.

    However, a better and scalable alternative is to implement the Access Control permissions at the Data Catalog level. This provides us the following advantages:

    • All the services that your Data Lake users use to process data leverage the same underlying catalog. And permissions are maintained there
    • The permissions are implemented centrally and can be managed at one place instead of duplicating at many services. Whenever users no longer need access to your Data Lake, you can delete their access at one place
    • You get a single view of who can access what. Simplifies audits

    Implementing Centralized Column Level Permissions in AWS Data Lakes

    Let’s look at how to implement a centralized column level permissions in AWS Data Lakes with an example.

    Sample Data

    I have got the New York City Taxi trip record data set in my S3 bucket. It’s organized month wise as below. This is a public dataset available here: https://registry.opendata.aws/nyc-tlc-trip-records-pds/.

    New York City Taxi trip data

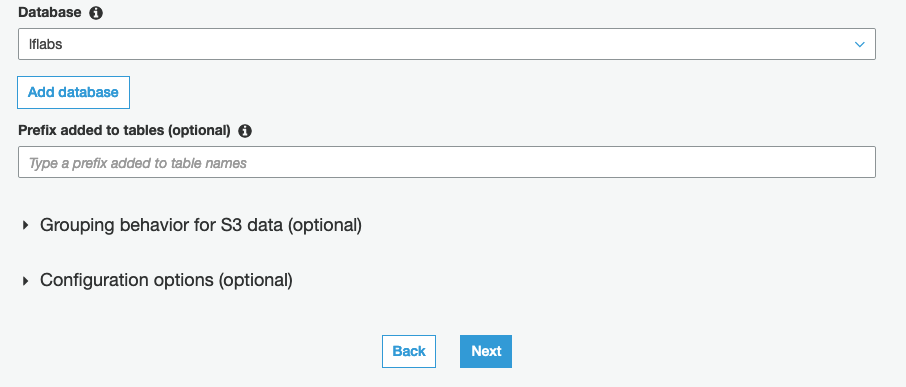
    Create a Database using AWS Lake Formation

    Head over to AWS Lake Formation and create a Database that will hold the metadata. For instructions on how to create a database, check this documentation: https://docs.aws.amazon.com/lake-formation/latest/dg/creating-database.html

    Create a AWS Glue crawler to populate metadata

    The next step is to create a Glue crawler, crawl the sample data and populate the metadata in the Lake Formation database that we created earlier. Check this documentation https://docs.aws.amazon.com/glue/latest/dg/console-crawlers.html for instructions or follow the step by step instructions in the Glue Console.

    When you create the crawler, provide the Lake Formation database that you created earlier as part of the Crawler’s output configuration.

    Once the crawler completes, go back to Lake Formation console and you should see a table created under “Tables”. Here’s a screenshot of my Lake Formation table. Your’s should look something similar.

    Here’s the table schema as discovered by the Glue crawler.

    Restricting access to few columns

    Let’s say, out of the above columns, we do NOT want regular users of our Data Lake to view the “fare_amount” and “total_amount” columns.

    For this purpose, I have created an IAM user called “dl-demo-user” for whom I would like to restrict the above two columns.

    1. In AWS Lake Formation, select the table that was populated by the Glue crawler
    2. Click on the Actions menu at the top and select the Grant option

    In the next screen, provide the following inputs:

    1. Select the IAM user(s) that you would like to restrict access. I chose the “dl-demo-user” that I created specifically for this demo
    2. In the “Columns” drop down, choose “Exclude columns
    3. Select the “fare_amount” & “total_amount” in the “Exclude columns” drop down
    4. For Table permissions, choose “Select

    That’s it.

    Now, I log in as the “dl-demo-user” and head over to Athena to execute the following query:

    select * from nyc_taxi LIMIT 10;

    The Athena query results no longer show the “fare_amount” and “total_amount” columns.

    If the same user were to use AWS EMR or Quicksight to access the same data, the user will NOT have access to the above two columns.

    However, when I run the same query using a different user, the query results include the “fare_amount” and “total_amount” columns.

    Viewing Data Permissions

    You can also use Lake Formation to get a single consolidated view of permissions across all users of your Data Lake.

    Click on “Data Permissions” from the left menu of the Lake Formation console to view all permissions. You can also use the “Grant” and “Revoke” buttons at the top to manage permissions from this page.

    Conclusion

    Implementing column level permissions is an important requirement for many organizations. Especially if your data lake consists of sensitive data (such as customer, sales, revenue), you would definitely have requirements to restrict access to certain fields only to few folks who have the necessary clearances.

    Such permissions when implemented at the Data Catalog level provides the following advantages:

    • Users of your Data Lake can continue to leverage different services like Athena, EMR, Glue, Quicksight to analyze the data
    • From a Data Governance point of view, you can manage permissions centrally at the Data Catalog level using Lake Formation
    • Permissions from Lake Formation automatically federate across all services without the need to duplicate it at each service
    • Whenever you need to add/delete users of your data lake, you get to manage it at one place

    Hope this article provided some ideas on how to implement column level permissions for your Data Lakes on AWS. What are some other tools/techniques that you use to implement the same? Do share them in the comments below.

  • Hey! (Cloud)Watch out those logs!!

    Time and again public clouds really prove that if you got to scale rapidly, there is no better place on earth you can. This time, it was the new email service Hey from the creators of Basecamp. Here’s an execellent write up from the company on how AWS helped them scale rapidly when they got way too much attention to their product.

    However, one interesting thing that struck me was this statement:

    Another gotcha: some services can rack up bills when you least expect it, like CloudWatch Logs. It integrates so easily with EKS! It’s just one button to click! And then you’re looking at your bill, going “where did this extra $50-$60 per day come from?”

    CloudWatch Logs allows you to ingest logs from various sources (your EC2 Instances, Containers, Lambda functions, tons of AWS services), store them centrally, analyze and gain insights. It’s a great service and anyone who has managed log aggregation at scale would appreciate the service a lot.

    It is also pretty easy to turn on this service. AWS has deeply integrated CloudWatch Logs with a whole lot of its managed services (such as VPC Flow Logs, EKS Control Plane logs). For serverless services such as AWS Lambda, API Gateway, CloudWatch Logs is the only mechanism to collect logs.

    However, one of the key challenges with CloudWatch Logs is how expensive the service can turn out to be.

    There are two aspects to CloudWatch Logs Pricing:

    • Ingestion Cost – at $0.5 per GB of log ingested
    • Storage Cost – at $0.03 per GB of logs stored

    Ingestion Cost

    Ingestion cost, while seems reasonably priced at the first glance, typically becomes a major line item in your bill. On a reasonably busy application/service, this can easily become 1000s of dollars every month.

    From AWS perspective, there is a good rationale to price it at $0.5 per GB. Ingestion means AWS needs to provision enough compute resources to capture all those logs being pushed to the service.

    When sending logs to CloudWatch Logs is as simple as selecting a checkbox, it is virtually impossible for customers to think about how much they would end up paying for it. Think about VPC Flow logs – its just impossible to predict what the volumes could be.

    Sure, over time one can begin to understand some trends between RPM and Log Ingestion rates. However, in practice, I have only seen developers focussing on optimizing CloudWatch logs only after someone at the top (typically who looks at the bill every month) brings the high costs of CloudWatch Logs to their notice.

    Storage Cost

    The storage cost is definitely much cheaper when compared to the ingestion costs. As you can see, it is priced similar to Standard S3 pricing because the logs are internally stored in S3.

    However, one major gap that people discover later is that the default configuration of Log Groups is to store the logs forever. Here’s the relevant documentation that talks about the default retention policy.

    So, its entirely left to the customer to figure this out and change the retention policy (and most customers figure this out only when they see a spike in their bill).

    AWS Console Behavior

    When you create a Log Group through the AWS Console, it just prompts you to provide a “Name”. “Retention Policy” is not asked as an input.

    Creating a Log Group through the AWS Management Console

    One needs to “Edit” the log group through the “Actions” menu to change the “Retention Policy” from the default “Forever” to something reasonable.

    Setting the Retention Policy for a Log Group

    In fact, the behavior of the APIs are also similar. Here’s the create-log-group CLI command:

      create-log-group
    --log-group-name <value>
    [--kms-key-id <value>]
    [--tags <value>]
    [--cli-input-json | --cli-input-yaml]
    [--generate-cli-skeleton <value>]
    [--cli-auto-prompt <value>]

    And one needs to use an additional put-retention-policy CLI command to change the retention policy:

      put-retention-policy
    --log-group-name <value>
    --retention-in-days <value>
    [--cli-input-json | --cli-input-yaml]
    [--generate-cli-skeleton <value>]
    [--cli-auto-prompt <value>]

    And for services such as EKS (which manages the Kubernets control plane), the only way to get the control plane logs is through CloudWatch Logs. If you look at the console, these are just simple checkboxes.

    Configuring EKS Control Plane logs that gets sent to CloudWatch Logs

    It’s pretty simple from usability perspective, but in this case, it’s the EKS service which abstracts the creation of the underlying Log Groups and the customer doesn’t really have the option to specify a retention policy.

    On a busy EKS cluster, these logs can quickly grow and CloudWatch Logs can easily become one of the major line items of the AWS bill.

    My Recommendations

    Configure retention policies

    Do NOT go with the default retention policies which retain the logs forever. A service like CloudWatch Logs is meant to be used as a Hot tier for logs. In Hot tier, logs are readily available for querying and dashboards. Most organizations need to have logs in “Hot” tier only for few weeks if not couple of months.

    So, make sure you are configuring a reasonable “Retention Policy” for your Log Groups.

    Archive to S3

    Once you no longer need logs in Hot tier, you can move those logs to a Warm tier. In a Warm tier, logs are not readily avialable for querying but they can still be “accessed” readily (as files). One can download specific files of interest and query locally or even push such files on-demand to a query engine like ElasticSearch.

    CloudWatch Logs provides an option to “Export Log Data to S3”. You can use this feature to periodically (using a “from” and “to” timestamp) export logs to S3. Please refer to this documentation for more details. Of course, you can automate this through the create-export-task API.

    Of course, you do want to have a Lifecycle Policy created on those S3 buckets so that those Archived logs don’t live in S3 forever

    Cost Allocation Tags for Log Groups

    When CloudWatch Logs costs become a concern, one of the areas that organizations struggle is first identifying the source/owner of such high costs Log Groups. More often, the person who is doing the cost optimization exercise is not the same as the person who creates/manages infrastructure.

    The standard and easiest way to address this is to use “Tagging”. Specific tags can be used as Cost Allocation Tags so that those tags appear in AWS bills and can be used to identify and allocate costs.

    The good news is that CloudWatch Log Groups also support tagging. If your organization has a tagging strategy identified, you can use the same to tag Log Groups as well. This helps in identiying teams/owners when CloudWatch Logs costs become an area of concern.

    The not-so-good news is that this Tagging feature is not available as part of the CloudWatch Management Console. However, its available as part of the APIs. Here’s the CLI command that can be used to tag a Log Group

      tag-log-group
    --log-group-name <value>
    --tags <value>
    [--cli-input-json | --cli-input-yaml]
    [--generate-cli-skeleton <value>]
    [--cli-auto-prompt <value>]

    Create Log Groups through Infrastructure As Code

    Needless to say, it’s best to create Log Groups through some Infrastructure As Code (IAC) utility such as AWS CloudFormation or Terraform. Doing so, you can take care of retention policies and tagging automatically.

    What’s interesting is though, the difference between these two popular methods of IAC:

    Appropriate Log Levels

    Of course this goes without saying: making sure code/application is logging at desired levels. You may not see the effect of too much verbose logging when you are logging to a file.

    However, if the same code is deployed as a Lambda function, you will see a direct impact in CloudWatch Logs cost. Every line that is streamed to CloudWatch Logs is going to be factored as part of the $0.5 per GB Ingestion cost.

    AWS can do a bit more

    I think AWS can do a bit more to help customers here.

    • Prompt for retention period during Log Group creation. Basically merge the create-log-group and put-retention-policy APIs. At the time of creation of the Log Group itself, the Console and the APIs should take the “Retention Policy” as an input
    • Services where CloudWatch Logs is deeply integrated (such as EKS control plane logs, Lambda, API Gateway), provide the “Retention Policy” settings as part of the configuration
    • Just like Vended Logs pricing, provide a tiered pricing for Data Ingestion. Or provide a commited discount (similar to RI) for Data Ingestion. Most applications can commit to certain volume of steady state logging and can benefit from discounts

    Lastly, I have seen enough customers worrying about CloudWatch Logs in general. So much that even a reasonably large company like Basecamp worries about the service. I think AWS should really work towards addressing customers’ concerns with this service.


    Logs are an important part of any application. While as developers and architects we love as much visbility through logs, it’s equally important to consider the trade offs with the actual cost of such visbility. Thinking ahead about the above aspects of CloudWatch Logs will go a long way in keeping costs of log aggregation under control.

    Hope this article helped in understanding how to keep CloudWatch Logs costs under control. If you do use other techniques, please do share those in the comments section below – would love to hear those!!

  • AWS re:Invent | Beyond The Shiny New Toys | Containers

    AWS re:Invent | Beyond The Shiny New Toys | Containers

    This is part of the Beyond The Shiny New Toys series where I write about AWS reInvent 2019 announcements

    AWS ecosystem around containers is pretty large. It comprises of AWS’ own orchestration engine, managed Kubernetes control planes, serverless container platforms, ability to run large scale batch workloads on containers. And a whole lot of deep integrations with rest of the AWS ecosystem for storage, logging, monitoring, security to name a few.

    AWS re:Invent 2019 saw quite a few announcements around containers. These announcements further simplify deploying and managing container workloads. Here are some of them that I liked.

    AWS Fargate for Amazon EKS

    https://aws.amazon.com/blogs/aws/amazon-eks-on-aws-fargate-now-generally-available/

    When EKS was launched last year, we saw this coming eventually. And here it is. You can now launch Kubernetes Pods on AWS Fargate with absolutely no infrastructure to manage.

    With Amazon EKS, AWS offered a managed Kubernetes control plane. This definitely solved a major pain point of dealing with all the moving parts (etcd!) of the Kubernetes control plane. However, customers still had to manage the worker nodes (where containers actually run) of the cluster – such as scaling them, patching them or keeping them secure.

    AWS Fargate is a fully managed, serverless offering from AWS to run containers at scale. AWS completely manages the underlying infrastructure for your containers (like AWS Lambda). Similar to Lambda, you only pay based on the memory, CPU used by your containers and how long the container ran.

    Fargate Profile

    One of the aspects that I liked about this launch is “Fargate Profile”. With a Fargate Profile, you can declare which Kubernetes pods you would like to be run on Fargate and which ones on your “own” EC2 based worker nodes. You can selectively schedule pods through Kubernetes “Namespace” and “Labels”.

    This means, with a single Kubernetes control plane (managed by EKS), an administrator can selectively schedule Kubernetes pods between Fargate and “EC2” based worker nodes. For example, you could have your “test/dev” workloads running on Fargate and “prod” workloads (where you may need more control for security/compliance) running on EC2 based worker nodes.

    Here’s an example Fargate Profile:

    {
        "fargateProfileName": "fargate-profile-dev",
        "clusterName": "eks-fargate-test",
        "podExecutionRoleArn": "arn:aws:iam::xxx:role/AmazonEKSFargatePodExecutionRole",
        "subnets": [
            "subnet-xxxxxxxxxxxxxxxx",
            "subnet-xxxxxxxxxxxxxxxx"
        ],
        "selectors": [
            {
                "namespace": "dev",
                "labels": {
                    "app": "myapp"
                }
            }
        ]
    }

    With the above fargate profile, pods in the namespace “dev” with labels “app”:”myapp” will automatically get scheduled on Fargate. Rest of the pods will get scheduled on EC2 worker nodes.

    All without any changes from the developer perspective – they deal only with Kubernetes objects without polluting those definitions with any Fargate specific configurations. Kudos to the AWS container services team for coming with such a clean design.

    Note: AWS ECS also works on a similar model through Launch Types. However, ECS control plane is AWS propreitary and they would have all the freedom to offer something like this. Offering something similar to Kubernetes is truly commendable

    AWS Fargate Spot

    https://aws.amazon.com/blogs/aws/aws-fargate-spot-now-generally-available/

    I guess it’s self explanatory. You get “Spot Instances” type capabilities in Fargate now. With “Termination Notification” to your Tasks. This translates to significant cost savings for workloads that can sustain interruption. You can read more about it in the above blog. However, I have mentioned it here as it serves as a pre-cursor for the next couple of new features that we are going to look at.

    Amazon ECS Capacity Providers

    https://aws.amazon.com/about-aws/whats-new/2019/12/amazon-ecs-capacity-providers-now-available/

    Capacity Providers, as the name suggests deal with providing compute capacity for the containers running on ECS. Previously, for ECS clusters on EC2, customers typically deploy an AutoScalingGroup to manage (and scale) the underlying EC2 Capacity or use Fargate (you control through Launch Types). 

    With Capacity Providers, customers now have the ability to attach different Capacity Providers for both ECS on EC2 and ECS on Fargate. A single ECS Cluster can have multiple Capacity Providers attached to it. We can also create weights across Capacity Providers (through Capacity Provider Strategy) to distribute ECS Tasks between different Capacity Providers (such as On-demand and Spot Instances).

    That sounds a bit complicated? Why is AWS even offering this? What use cases does it solve? Let’s look at a few:

    Distribution between On-demand Spot Instances

    Let’s say you want to mix On-demand and Spot Instances in your cluster to maintain availability and derive cost savings. Your ECS Cluster can have two Capacity Providers – one comprising of an AutoScalingGroup1 with On-demand Instances and another comprising of an AutoScalingGroup2 with Spot Instances. You can then assign different weights between these Capacity Providers controlling how much percentage Spot Instances you are willing to utilize. In the below example, you have 30% Spot and 70% On-demand Instances by assigning weights 1 and 2 to respective Capacity Providers.

    A single ECS cluster having a mix of on-demand and spot capacity through Capacity Providers

    Fargate and Fargate Spot

    Just like EC2, Fargate also becomes a Capacity Provider for your cluster. Which means, you can extend the above concept to control how much Fargate Spot you would want in your cluster.

    Better spread across Availability Zones

    Extending the “weights” that you can assign to Capacity Providers, you can now get better spread of “ECS Tasks and Services” across Availability Zones. For example, you could create 3 Capacity Providers (each having an AutoScalingGroup tied to a single Availability Zone) with equal weights and ECS would take care of evenly spreading your Tasks.

    This wasn’t possible earlier because ECS and the underlying AutoScalingGroup weren’t aware of each other. Earlier, you would create a single AutoScalingGroup that is spread across multiple Availability Zones making sure the EC2 Instances are spread across AZs. However, when ECS scheduler runs your “Tasks” it doesn’t necessarily spread the “Tasks” evenly across AZs.

    Even spreading of “Tasks” through CapacityProviders is now possible as ECS can now manage the underlying AutoScalingGroup as well through “Managed Cluster Auto Scaling” (a new feature described below).


    ECS Managed Cluster Auto Scaling

    https://aws.amazon.com/about-aws/whats-new/2019/12/amazon-ecs-cluster-auto-scaling-now-available/

    Prior to the launch of this feature, ECS did not have the capability to manage the underlying AutoScalingGroup. You created the ECS cluster separately and the AutoScalingGroup for the underlying Instances separately. The AutoScalingGroup scaled based on the metrics of “tasks” (such as CPU) that are “already running” on the cluster.

    So what’s the challenge with this type of scaling?

    When you create your “Service” in ECS, you can setup AutoScaling for the service. For example, you can setup a Target Tracking Scaling Policy, that tracks the metrics of your running “Tasks” (of the Service) and scale the number of “Tasks” based on those metrics. This works similar to AutoScaling of EC2 Instances.

    However, what about the scenario when your “Service” on ECS scales, but there is insufficient underlying capacity as the EC2 AutoScalingGroup hasn’t scaled EC2 Instances yet? You see the disconnect?

    With “ECS Managed Cluster Auto Scaling”, this missing gap is now addressed. When your “Service” on ECS scales, ECS will dynamically adjust the “scaling policies” of the underlying EC2 AutoScalingGroup as well. Once EC2 scales and capacity is available, the “Tasks” would be automatically scheduled on them.

    Note: This is pretty similar to ClusterAutoScaler in Kubernetes where it works alongside HorizontalPodAutoScaler. When there are more “Pods” that needs to be scheduled and there is no available underlying capacity, ClusterAutoScaler kicks in and scales the capacity. Pods will eventually gets scheduled automatically once capacity is available.


    Closing Thoughts

    On the ECS front, Capacity Providers and Managed Cluster Auto Scaling make it much more powerful and provides more control and flexibility. On the other hand, it does add a bit of complexity from a developer perspective. It still doesn’t come close enough to simply launching a container and getting an endpoint that is highly available and scales automatically.

    On the EKS front, Fargate for EKS is the right step towards offering a “serverless” Kubernetes service. I liked the fact that you can continue to use Kubernetes “primitives” such as Pod/Deployment and you can control using “Fargate Profile” to selectively schedule Pods to Fargate. This is a different direction from GCP’s Cloud Run which can simply take a Container Image and turn it into an endpoint.

    I am assuming AWS will continue to iterate in this space and address all the gaps. Looking at the plethora of options available, it appears that AWS wants to address different types of container use cases coming out of its vast customer base.

    ECS Vs Kubernetes

    And looking at the iterations and features on ECS, it looks like ECS continues to see customer adoption despite the gaining popularity of Kubernetes. AWS doesn’t iterate on services when it doesn’t see enough customer adoption. Remember SimpleDB? Simple Work Flow? Elastic Transcoder? Amazon Machine Learning?

    Whenever they don’t see enough traction, AWS is quick to pivot to newer services and rapidly iterate (they would still operate and support older services). The continued iterations on both ECS and EKS front suggests that there is currently a market for both the orchestration engines. Only time would tell if it would be otherwise.


    Well those are the announcements that I found interesting in the area of Containers. Did I miss anything? Let me know in the comments.

  • AWS re:Invent | Beyond The Shiny New Toys | Networking

    AWS re:Invent | Beyond The Shiny New Toys | Networking

    This is part of the Beyond The Shiny New Toys series where I write about AWS reInvent 2019 announcements

    Networking in AWS has always been continuously evolving to support wide range of customer use cases. Back in the early days of EC2, all customer Instances were in a flat EC2 network called EC2-Classic (there is still documentation that talks about this). 10 years ago, AWS introduced VPC which fundamentally changed the way we think about Networking and it has rapidly accelerated the adoption of public cloud.

    Since the introduction VPC, the networking landscape within AWS started evolving pretty rapidly. You started getting capabilities such as VPC peering, NAT Gateways, Private endpoints for AWS services (such as S3, DynamoDB) within your VPC (so that traffic to those services do not leave your VPC). AWS also launched PrivateLink which allows your applications running in VPC securely access other applications (of yours and third party). And with their acquisition of Annapurna Labs, AWS started pushing the network capabilities even further such as 100Gbps networking, faster EBS-optimized performance, transparent hardware based encryption (almost nil performance overhead for your workloads).


    New Networking Capabilities

    While the AWS Networking stack continues to always improve through the year, reInvent 2019 had its fair share of announcements related to Networking. Here are some of the new features that I specifically found to be interesting.

    Transit Gateway Inter Region Peering

    https://aws.amazon.com/about-aws/whats-new/2019/12/aws-transit-gateway-supports-inter-region-peering/

    AWS Transit Gateway allows you to establish a single gateway on AWS and connect all your VPCs, your datacenter (through a Direct Connect / VPN) and office locations (VPN). You no longer have to maintain multiple peering connections between VPCs. This changed your network topology to a Hub and Spoke model as depicted below

    So, if you have multiple VPCs that needs to connect to each other (and with on-premise data centers or branch offices), Transit Gateway simplifies the networking topology. However, if you are operating in multiple AWS regions (which most large customers do), and want to build a global network, then you need connectivity between the Transit Gateways.

    This type of cross region connectivity between Transit Gateways was not possible earlier. Now, with Transit Gateway peering, you can easily connect multile AWS regions and build a global network.

    Transit Gateway peering across AWS regions

    Traffic through the peering connection is automatically encrypted and is routed over the AWS backbone. This is currently available (at the time of writing) in US-East (N.Virginia), US-East(Ohio), US-West(Oregon), EU-Ireland EU-Frankfurt regions and I would expect AWS to roll this out globally based on customer demand.

    Building a Global Network

    Building a Global Network that spans across multiple AWS regions connecting your data center and branch offices have become simpler with the following services/features:

    There were also quite a few other features announced around reInvent 2019 that ups the game when it comes to building a scalable and reliable Global Network. Few notable mentions:

    • Accelerated Site-to-Site VPN: This uses the AWS Global Accelerator to route traffic through AWS edge locations and the AWS Global Backbone. Improves VPN performance from branch offices
    • Multicast workloads: Transit Gateway now supports multicast traffic between the attached VPCs. A feature asked by many large enterprises for running clusters and media workloads
    • Visualizing your Global Network: If you are building out such a complex Global Network, you would need a simpler way to visualize your network and take actions. The new Transit Gateway Network Manager allows you to centrally monitor your Global Network

    If you would like to understand more about various architecture patterns, check out this deep dive talk by Nick Mathews at re:Invent 2019.

    Application Load Balancer – Weighted Load Balancing

    When you are rolling out a new version of your app, you need some kind of strategy to transition users from the older version to the new version. Depending upon your needs, you employ techniques such as Rolling Deployments, Blue/Green Deployments or Canary Deployments.

    All of these techniques require some component in your infrastructure to selectively route traffic between the different versions. There are few ways in which you can do these in AWS today:

    • Using Route 53 DNS routing policy. For example, you can use Weighted Routing policy to control how much traffic is routed to each resource (having two different ALBs/ELBs running different versions of your app)
    • You could have different AutoScalingGroups attached to the same ALB and adjust the ASGs to shape your traffic

    With this new “Weighted Load Balancing” feature in ALB, you can achieve the same with one ALB.

    • You create multiple Target Groups with each having EC2 Instances running different versions of your app
    • Under the “Listeners” of your ALB, you add the “Target Groups” and assign different weights to different Target Groups

    Once you do the above, ALB would split the incoming requests based on the weights and route appropriate requests to each of the Target Groups.

    Migration Use Cases

    One other great use case for this feature is migration. Target Groups are not limited to just EC2 Instances. Target Groups can be EC2 Instances, Lambda functions, containers running ECS/EKS or even just IP addresses (say you have a VM in a data center). So, you can use this capability to even migrate from one environment to the other by gradually shifting traffic.

    If you would like to learn more about this new feature, check out this blog.

    Application Load Balancer – LOR Algorithm

    https://aws.amazon.com/about-aws/whats-new/2019/11/application-load-balancer-now-supports-least-outstanding-requests-algorithm-for-load-balancing-requests/

    The default algorithm that an Application Load Balancer (ALB) uses to distribute traffic is Round Robin. This fundamentally assumes that the processing time for all types of requests of your app is the same. While this may be true for most consumer facing apps, a lot of business apps have varying processing times for different functionalities. This would lead to some of the instances getting over utilized and some under utilized.

    ALB now supports Least Outstanding Requests (LOR) algorithm. If you configure your ALB with LOR algorithm, ALB monitors the number of outstanding request of each target and sends the request to the one with the least number of outstanding requests. If you have some targets (such as EC2 Instances) that are currently processing some long requests, they will not be burdened with more requests.

    This is available to all existing and new ALBs across all regions. A great feature!! There are some caveats too (such as how this would work with Sticky Sessions). Check out this documentation for more details.

    Better EBS Performance

    https://aws.amazon.com/about-aws/whats-new/2019/12/amazon-ec2-nitro-system-based-instances-now-support-36-faster-amazon-ebs-optimized-instance-performance/

    These are the things that I love about being on public cloud. Any EBS intensive workload, automatically gets better network throughput. At no additional cost. Without me doing anything. Just like that!!


    Well those are the announcements that I found interesting in the Networking domain. Did I miss anything? Let me know in the comments.

  • AWS re:Invent | Beyond The Shiny New Toys | Security

    AWS re:Invent | Beyond The Shiny New Toys | Security

    This is part of the Beyond The Shiny New Toys series where I write about AWS reInvent 2019 announcements

    Security in Architectures is an area I am passionate about. One of the most important things that I learnt during my tenure at Amazon is thinking about Security at the beginning of everything. You cannot build a great feature and then think about Security. You rather think about Security before even you start building out features.

    Jeff Bezos always says “Customers are not going to wake up tomorrow morning and say they are willing to pay more”. Similarly, I would argue that “Customers are not going to tell you that they are OK to use a product/feature that is not secure by design”

    Most folks call out On-demand provisioning, Elasticity, Cost efficiencies as benefits of Cloud. While those are definitely true, one of the most important aspect of Cloud is that it drastically changes the Security posture for everyone. A customer who pays $100 a month gets the same security baseline and features as an Enterprise who is running a highly regulated workload. And the baseline continuously improves.

    Lets look at some of the important announcements made in the Security domain during re:Invent 2019.

    Unused IAM Roles

    https://aws.amazon.com/about-aws/whats-new/2019/11/identify-unused-iam-roles-easily-and-remove-them-confidently-by-using-the-last-used-timestamp/

    IAM Roles have become such a fundamental building block for applications running on AWS. An IAM Role provides temporary access credentials to anyone assuming the Role. There are plenty of use cases for IAM Roles such as: applications running on EC2 Instances assuming a Role to get temporary creds, services such as Lambda/Kinesis talking to other services, users assuming roles to log in to AWS accounts (through SSO) and so on.

    Pretty quickly your AWS account can get filled with plenty of such IAM Roles and you may start loosing track of which IAM Roles are actually being in use.

    To know if you a particular IAM Role is being used or not, through Access Advisor, you can now check the latest timestamp when the Role creds were used to access an AWS API. Under IAM, go to Roles and choose any Role to open it’s Summary page. You will find a tab called “Access Advisor” where you can view when the Role was last used.

    Access Advisor Tab of an IAM Role showing service permissions granted by the role and when those services were last accessed

    This is a pretty useful feature to look at all your IAM Roles and understand which ones are being actively used. And then drilling down to “Access Advisor” to find out which policies of the Role are being used. In the above example, it appears that Application Auto Scaling and App Mesh policies are not used by this Role and you can start invetigating if you really need these policies as part of the role.

    Attribute Based Access Control

    https://aws.amazon.com/blogs/security/simplify-granting-access-to-your-aws-resources-by-using-tags-on-aws-iam-users-and-roles/

    We have been traditionally used to the concept of Role Based Access Control (RBAC). RBAC allows us to make sure we are able to provide access to users and machines based on their “Role”. On AWS, this is typically implemented through a combination of IAM Users, Roles and Groups.

    For example, you could create IAM Groups such as “devs”, “admins”, “superadmins” with different set of IAM policies attached to them. You would then add users to those Groups and they automatically get relevant access.

    While this model works in general, if you have lots of different projects and teams, it can get pretty complex to manage. For example, you will have users move from one project to another and they may need new set of permissions. You then end up creating newer set of policies and groups and this can go on for ever.

    IAM recently introduced the ability to add “Tags” on IAM Principals – Users and Roles. With this, administrators can write simple policies based on “Tags” associated with the “Users” and the “Resources”.

    As an example, let’s say you have a Tagging structure where EC2 resources are tagged with the key “team“. You could have a generic policy where you could allow “Users” to Start/Stop EC2 Instances only if the Instances have a Tag called “teamwhose value matches the User’s Tag called “team”.

    This can be achieved through a policy like:

    
        "Version": "2012-10-17",
        "Statement": [
            {
                "Effect": "Allow",
                "Action": [
                    "ec2:DescribeInstances"
                ],
                "Resource": "*"
            },
            {
                "Effect": "Allow",
                "Action": [
                    "ec2:StartInstances",
                    "ec2:StopInstances"
                ],
                "Resource": "*",
                "Condition": {
                    "StringEquals": {
                        "ec2:ResourceTag/team": "${aws:PrincipalTag/team}"
                    }
                }
            }
        ]
    }

    This dramatically simplifies how you manage Policies at Scale where you no longer have to create different set of policies based on different use cases.

    If you use a SAML based Identity Provider (such as Active Directory) to federate into AWS console and APIs, you could use attributes in your IdP to achieve the same. You could learn more about this here: https://aws.amazon.com/blogs/security/rely-employee-attributes-from-corporate-directory-create-fine-grained-permissions-aws/

    If you want to learn more about this, watch this awesome session by Brigid Johnson:

    IAM Access Analyzer

    https://aws.amazon.com/blogs/aws/identify-unintended-resource-access-with-aws-identity-and-access-management-iam-access-analyzer/

    This is another example of how being on a large Cloud Platform like AWS automatically improves security for everyone. We earlier saw how you can identify usage of your IAM Roles. While IAM Roles gives temporary creds to access services, on the services side, you can apply policies (called as Resource Based Policies) to control who has access to services (such as S3, SQS) and what actions can they perform. With this, even if someone gets a credential through IAM Role to access a service, if the service’s policies do not allow access then those requests would fail.

    So, Resource Based Policies are super important and you can find the list of supported services here.

    While this is a great way to protect your services, how do you know that these policies are set the way you intended to be? How about these questions:

    • I had created a S3 bucket and allowed Read access from another AWS account. Does that AWS account still have only Read access?
    • I created an IAM Role for a federated user to assume when they log in using their SAML based IdP. This was few months ago. Are we sure nobody else has permissions to assume the Role now?

    These are the kind of questions that you care about deeply. Validating this manually can be pretty daunting. That’s where IAM Access Analyzer can help.

    Once enabled, IAM Access Analyzer continuously monitors resources (currently supports S3, SQS, IAM Roles, KMS and Lambda) and reports findings wherever a resource is accessed by a Principal outside the AWS account. The findings are provided within the IAM Console itself from where you can start taking actions. If you find the access to be as intended, you can simply “Archive” them. If you see some resources that looks suspicious, you can jump to respective consoles and take actions (such as turning off public access to your S3 bucket).

    source: https://aws.amazon.com/blogs/aws/identify-unintended-resource-access-with-aws-identity-and-access-management-iam-access-analyzer/

    Here’s a detailed blog post on how you can use Access Analyzer to understand which of your S3 buckets have “Public Access” or access from other AWS accounts: https://aws.amazon.com/blogs/storage/protect-amazon-s3-buckets-using-access-analyzer-for-s3/

    The best part of this feature: it doesn’t cost anything. And it can be turned ON in a click.

    Instance Metadata Service V2

    https://aws.amazon.com/blogs/security/defense-in-depth-open-firewalls-reverse-proxies-ssrf-vulnerabilities-ec2-instance-metadata-service/

    Instance Metadata Service (IMDS) is the internal service in AWS that provides temporary AWS credentials to EC2 Instances through the IAM Role that is attached to the Instance. From within an EC2 Instance, you can hit 169.254.169.254 to access the IMDS service.

    This service has been available for more than 10 years now quietly working behind the scenes doing the heavy lifting of providing temporary, frequently rotated AWS credentials.

    Earlier this year, Capital One had a breach where there was unauthorized access by an outsider who obtained Capital One’s customer data. This breach happened through a technique called SSRF (Server Side Request Forgery). You can read more details about this incident here.

    This incident involved the EC2 IMDS. Once someone has access to an EC2 Instance with an attached IAM Role, you have access to the EC2 IMDS. Depending on the policies on the IAM Role attached to the EC2 Instance, you can start interacting with those AWS services. In Capital One’s case, the IAM Role seem to have had excessive permissions to S3 thereby allowing the attacker to download data from S3.

    This isn’t pointing the blame at AWS. As AWS calls out , Security is a Shared Responsibility model where the customer equally owns the Security of the infrastructure that they are running.

    However, AWS seems to have thought on how they can make it better and protect their customers. The effect of that is V2 of IMDS. In IMDS V2, there are additional protection to the service against attacks such as SSRF. Specifically, V2 provides:

    • Protection against Open Reverse Proxies
    • Protection against SSRF Vulnerabilities
    • Protection against Open Layer 3 Firewalls and NATs

    Using IMDS V2

    • You can start using IMDS V2 by upgrading your AWS SDKs (that your apps running on EC2 use) to their latest version. The latest AWS SDKs automatically use IMDS V2
    • In addition, there is a new CloudWatch metric called “MetadataNoToken” for EC2 Instances. This is a new metric that tells you “the numer of times the IMDS was accessed through V1”. You can start monitoring this metric to understand how many Instances are still using V1
    • Once the above metric becomes 0 (meaning all are using V2), you can have IAM Policies that blocks Instances being launched with V1 (essentially you can enforce usage of V2 only)
    • CloudTrail also now records if the credentials were provided using V1 or V2

    If you want to learn more about IMDS V2, read this blog post and this documentation.

    AWS recommends that you start adopting V2. V1 will continue to be supported indefinitely and continues to be secure. However V2 provides additional protection. No harm in being more secure 🙂


    Well those are the announcements that I found interesting in the security domain. Did I miss anything? Let me know in the comments.

  • Beyond The Shiny New Toys | Redshift

    Beyond The Shiny New Toys | Redshift

    This is part of the Beyond The Shiny New Toys series where I write about AWS reInvent 2019 announcements

    Amazon Redshift has been going through a series of major changes which tremendously simplifies schema design and overall management of workloads. Here are some of the new features that were announced around the re:Invent 2019 timeframe that I specifically think a lot of customers (based on my earlier interaction with them) would look to put in use

    Materialized Views

    https://aws.amazon.com/about-aws/whats-new/2019/11/amazon-redshift-introduces-support-for-materialized-views-preview/

    This has been one of the most wanted asks from many customers who migrate from other DW systems into Redshift. Materialized Views (MV) have a significant improvement on query performance for repeated workloads such as Dashboarding, queries from BI tools or certain predictable steps in ETL pipelines.

    Till now, Redshift lacked support for MV and the recommendation has been to either modify your workloads or implement architectural changes such as performing a query rewrite using pg_bouncer

    You can now use the native MV (available in preview) capability to address such needs. There are some current limitations though. For example, you need to manually refresh the MV whenever your base tables undergo changes. Over time, I am sure AWS folks would address these limitations based on customer feedback. You can find the complete set current limitations here: https://docs.aws.amazon.com/redshift/latest/dg/mv-usage-notes.html

    Automated Table Sort

    https://aws.amazon.com/about-aws/whats-new/2019/11/amazon-redshift-introduces-automatic-table-sort-alternative-vacuum-sort/

    One of the most important best practices when it comes to Redshift is to keep the data Sorted. This would directly improve query performance as Redshift can read specific blocks of data (when your query has a filter) and also apply compression better. If your data is NOT sorted well enough, Redshift may read unwanted blocks and then later skip them in the memory. So, on incremental data loads, you had to earlier run “VACUUM SORT” command to make sure the data blocks are sorted.

    With this new feature, Redshift automatically performs the Sorting activity in the background without any interruption to query processing. However, if you do have large data loads, you may still want to run “VACUUM SORT” manually (as Automatic Sorting may take a while to fully Sort in the background).

    You can also monitor the “vacuum_sort_benefit” and “unsorted” columns in the SVV_TABLE_INFO table. Together, these columns tell you the following:

    1. What percentage of a particular table is “unsorted”
    2. How much percentage benefit would you derive by running “VACUUM SORT” against the table

    Check the following documentation for more details: https://docs.aws.amazon.com/redshift/latest/dg/t_Reclaiming_storage_space202.html#automatic-table-sort

    ALTER SORT KEY Dynamically

    https://aws.amazon.com/about-aws/whats-new/2019/11/amazon-redshift-supports-changing-table-sort-keys-dynamically/

    When you start using Redshift, you pick Distribution and Sort Keys for your tables. However, over time, as your workload evolves there may be a need to modify the Sort Keys that you originally picked. Previously, this meant, recreating your table with the new set of Sort Keys and loading all the data into that newly created table. This was required because, Redshift physically sorts the data in the underlying disks. Changing your Sort Keys meant re-sorting your data.

    With this new feature, you can now dynamically change the Sort Keys of your existing table. Redshift, behind the scenes will re-sort the data while your table continues to be available for querying. This provides more flexibility when it comes to schema design.

    Cross Instance Restore

    https://aws.amazon.com/about-aws/whats-new/2019/11/amazon-redshift-launches-cross-instance-restore/

    This is another important feature and one that has been long requested by customers. You may want to restore a snapshot of production DC2.8XL cluster into a smaller DC2.Large cluster for your test/dev purposes. Or you may have a DC2.Large cluster with many number of nodes. You have a snapshot of that cluster and wish to launch a cluster with smaller number of DC2.8XL cluster. This wasn’t possible until this capability was introduced.

    One of the important aspects that you want to consider when doing this exercise is to undersatnd how would your “target” cluster’s storage utilization on each node would look like. The following command in the AWS CLI would throw you some options to consider:

    aws redshift describe-node-configuration-options --snapshot-identifier <mycluster-snapshot> --region eu-west-1 -—action-type restore-cluster

    Automatic Workload Management

    https://aws.amazon.com/about-aws/whats-new/2019/09/amazon-redshift-announces-automatic-workload-management-and-query-priorities/

    This isn’t a re:Invent timeframe announcement as such. This was announced in September. But I am including it here because this is a big one and simplifies day to day operations of a Redshift cluster for an administrator.

    Even some of the large Redshift customers find it cumbersome to perform Workload Management (WLM) on Redshift. WLM on itself is a pretty deep topic and is something that you cannot avoid once your workloads start scaling on Redshift.

    WLM provides many controls for a Redshift administrator to manage different workloads and give better experience for all types of users of the system. Over the years, WLM has evolved from a static configuration to a dynamic configuration (of queues and memory) with Queue Priorities, Query Monitoring Rules, Queue Hopping, Short Query Acceleration and Concurrency Scaling.

    However all of these require someone to continuously observe the workloads on the cluster and keep tweaking these configurations. With Automatic WLM, Redshift removes much of these overheads from the administrator.

    With Automatic WLM, you still define Queues, Queue Priorities, User/Query Groups and configure Concurrency Scaling (for required Queues). Automatic WLM will then dynamically manage memory allocation and concurrency amongst these queues based on the workload. Automatic WLM also works with Short Query Acceleration allowing short running queries to complete.

    If you are managing WLM manually today, it might be worthwhile taking a look at this feature. You can read more about how Automatic WLM works here: https://docs.aws.amazon.com/redshift/latest/dg/automatic-wlm.html

    A few more noteworthy ones

    These are few more features that got added over the couse of 2019 – just ICYMI

    I believe with all these new capabilities, Redshift has now automated a whole lot of operations making administrators’ life simpler. Put it in typical Amazon way, Redshift now takes care of most of the “undifferentiated heavy lifting” 🙂

    Did I miss any new major announcement? What do you think about these features? Do let me know your thoughts in the comments section below.

  • AWS re:Invent|Beyond The Shiny New Toys |Redshift

    AWS re:Invent|Beyond The Shiny New Toys |Redshift

    This is part of the Beyond The Shiny New Toys series where I write about AWS reInvent 2019 announcements

    Redshift has been going through a series of major changes which tremendously simplifies schema design and overall management of workloads. Here are some of the new features that were announced around the re:Invent 2019 timeframe that I specifically think a lot of customers (based on my earlier interaction with them) would look to put in use.

    Materialized Views

    https://aws.amazon.com/about-aws/whats-new/2019/11/amazon-redshift-introduces-support-for-materialized-views-preview/

    This has been one of the most wanted asks from many customers who migrate from other DW systems into Redshift. Materialized Views (MV) have a significant improvement on query performance for repeated workloads such as Dashboarding, queries from BI tools or certain predictable steps in ETL pipelines.

    Till now, Redshift lacked support for MV and the recommendation has been to either modify your workloads or implement architectural changes such as performing a query rewrite using pg_bouncer

    You can now use the native MV (available in preview) capability to address such needs. There are some current limitations though. For example, you need to manually refresh the MV whenever your base tables undergo changes. Over time, I am sure AWS folks would address these limitations based on customer feedback. You can find the complete set current limitations here: https://docs.aws.amazon.com/redshift/latest/dg/mv-usage-notes.html

    Automated Table Sort

    https://aws.amazon.com/about-aws/whats-new/2019/11/amazon-redshift-introduces-automatic-table-sort-alternative-vacuum-sort/

    One of the most important best practices when it comes to Redshift is to keep the data Sorted. This would directly improve query performance as Redshift can read specific blocks of data (when your query has a filter) and also apply compression better. If your data is NOT sorted well enough, Redshift may read unwanted blocks and then later skip them in the memory. So, you choose a SORT Key for your table initially and on incremental data loads, you had to earlier run “VACUUM SORT” command to make sure the data blocks are sorted.

    With this new feature, Redshift automatically performs the sorting activity in the background without any interruption to query processing. However, if you do have large data loads, you may still want to run “VACUUM SORT” manually (as Automatic Sorting may take a while to fully Sort in the background).

    You can also monitor the “vacuum_sort_benefit” and “unsorted” columns in the SVV_TABLE_INFO table. Together, these columns tell you the following:

    1. What percentage of a particular table is “unsorted”
    2. How much percentage benefit would you derive by running “VACUUM SORT” against the table

    Check the following documentation for more details: https://docs.aws.amazon.com/redshift/latest/dg/t_Reclaiming_storage_space202.html#automatic-table-sort

    ALTER SORT KEY Dynamically

    https://aws.amazon.com/about-aws/whats-new/2019/11/amazon-redshift-supports-changing-table-sort-keys-dynamically/

    When you start using Redshift, you pick Distribution and Sort Keys for your tables. However, over time, as your workload evolves there may be a need to modify the Sort Keys that you originally picked. Previously, this meant, recreating your table with the new set of Sort Keys and loading all the data into that newly created table. This was required because, Redshift physically sorts the data in the underlying storage. Changing your Sort Keys meant re-sorting your data.

    With this new feature, you can now dynamically change the Sort Keys of your existing table. Redshift, behind the scenes will re-sort the data while your table continues to be available for querying. This provides more flexibility when it comes to schema design.

    Cross Instance Restore

    https://aws.amazon.com/about-aws/whats-new/2019/11/amazon-redshift-launches-cross-instance-restore/

    This is another important feature and one that has been long requested by customers. You may want to restore a snapshot of production DC2.8XL cluster into a smaller DC2.Large cluster for your test/dev purposes. Or you may have a DC2.Large cluster with many number of nodes. You have a snapshot of that cluster and wish to launch a cluster with smaller number of DC2.8XL cluster. This wasn’t possible until this capability was introduced.

    One of the important aspects that you want to consider when doing this exercise is to undersatnd how would your “target” cluster’s storage utilization on each node would look like. The following command in the AWS CLI would throw you some options to consider:

    aws redshift describe-node-configuration-options --snapshot-identifier <mycluster-snapshot> --region eu-west-1 -—action-type restore-cluster

    Automatic Workload Management

    https://aws.amazon.com/about-aws/whats-new/2019/09/amazon-redshift-announces-automatic-workload-management-and-query-priorities/

    This isn’t a re:Invent timeframe announcement as such. This was announced in September. But I am including it here because this is a big one and simplifies day to day operations of a Redshift cluster for an administrator.

    Even some of the large Redshift customers find it cumbersome to perform Workload Management (WLM) on Redshift. WLM on itself is a pretty deep topic and is something that you cannot avoid once your workloads start scaling on Redshift.

    WLM provides many controls for a Redshift administrator to manage different workloads and give better experience for all types of users of the system. Over the years, WLM has evolved from a static configuration to a dynamic configuration (of queues and memory) with Queue Priorities, Query Monitoring Rules, Queue Hopping, Short Query Acceleration and Concurrency Scaling.

    However all of these require someone to continuously observe the workloads on the cluster and keep tweaking these configurations. With Automatic WLM, Redshift removes much of these overheads from the administrator.

    With Automatic WLM, you still define Queues, Queue Priorities, User/Query Groups and configure Concurrency Scaling (for required Queues). Automatic WLM will then dynamically manage memory allocation and concurrency amongst these queues based on the workload. Automatic WLM also works with Short Query Acceleration allowing short running queries to complete.

    If you are managing WLM manually today, it might be worthwhile taking a look at this feature. You can read more about how Automatic WLM works here: https://docs.aws.amazon.com/redshift/latest/dg/automatic-wlm.html

    A few more noteworthy ones

    These are few more features that got added over the couse of 2019 – just ICYMI

    I believe with all these new capabilities, Redshift has now automated a whole lot of operations making administrators’ life simpler. Put it in typical Amazon way, Redshift now takes care of most of the “undifferentiated heavy lifting” 🙂


    Well those are the Redshift announcements that I found interesting. Did I miss anything? Let me know in the comments.

  • Beyond The Shiny New Toys

    Beyond The Shiny New Toys

    This is one of my favorite time of the year when it comes to AWS. Yes, the time around re:Invent where AWS launches a whole bunch of new Services and Features. Over the years, it has become a bit of overwhelming for me with the sheer number of announcements. Last year, during the week of re:Invent 2018 AWS announced about 100 major new Services and Features. This year AWS has gone one step further with pre:Invent. More than 100 new Features/Services already announced in the two weeks run up to re:Invent 2019.

    At every re:Invent, AWS continues to push the platform forward with some amazing innovative services. Nobody imagined that AWS would drive a truck to your datacenter. And who thought you could get a Ground Station at a click of a button? May be this year (I am writing this post a week before re:Invent) they would launch a service for “Inter Planetary Travel”. Or a feature in Sagemaker that builds an AWS service automatically from your thoughts.

    Jokes apart, AWS would continue to innovate at a rapid clip on behalf of cutsomers and it is super exciting to see all these services coming our way. At the same time, these are shiny new toys that address some very specific use cases. What majority of the customers end up adopting are the Features & Services released in the areas of “fundamental building blocks”. These are in the areas of Compute, Storage, Networking, Secuirty, Analytics, Management Tools and Cost Optimization that are core to most workloads that businesses run on the Cloud.

    This series of posts focus on new Services and Features in these building blocks. I will try to collate as much as possible from the rampage of announcements under specific topics. As I add more posts, I will also collate them and list them here so that this post becomes a “master” post by itself.

  • AWS re:Invent | Beyond The Shiny New Toys

    AWS re:Invent | Beyond The Shiny New Toys

    This is one of my favorite time of the year when it comes to AWS. Yes, the time around re:Invent where AWS launches a whole bunch of new Services and Features. Over the years, it has become a bit of overwhelming for me with the sheer number of announcements. Last year, during the week of re:Invent 2018 AWS announced about 100 major new Services and Features. This year AWS has gone one step further with pre:Invent. More than 100 new Features/Services already announced in the two weeks run up to re:Invent 2019.

    At every re:Invent, AWS continues to push the platform forward with some amazing innovative services. Nobody imagined that AWS would drive a truck to your datacenter. And who thought you could get a Ground Station at a click of a button? May be this year (I am writing this post a week before re:Invent) they would launch a service for “Inter Planetary Travel”. Or a feature in Sagemaker that builds an AWS service automatically from your thoughts.

    Jokes apart, AWS would continue to innovate at a rapid clip on behalf of cutsomers and it is super exciting to see all these services coming our way. At the same time, these are shiny new toys that address some very specific use cases. What majority of the customers end up adopting are the Features & Services released in the areas of “fundamental building blocks”. These are in the areas of Compute, Storage, Networking, Secuirty, Analytics, Management Tools and Cost Optimization that are core to most workloads that businesses run on the Cloud.

    This series of posts focus on new Services and Features in these building blocks. I will try to collate as much as possible from the rampage of announcements under specific topics. As I add more posts, I will also collate them and list them here so that this post becomes a “master” post by itself.